
How to simulate the isotope pattern of a molecule (mass spectrum)
Tutorial · macOS and Windows
Chlorine, bromine, sulfur and many metals have heavy isotopes that leave a fingerprint in the molecular-ion region of a mass spectrum. ChemPencil simulates that isotope pattern from the structure, so you can compare it with your measured spectrum.
Show the pattern
- Draw the molecule.
- Open (Mac) or (Windows).
- The Spectrum tab plots the peaks; the Peaks tab lists each m/z with its relative intensity.
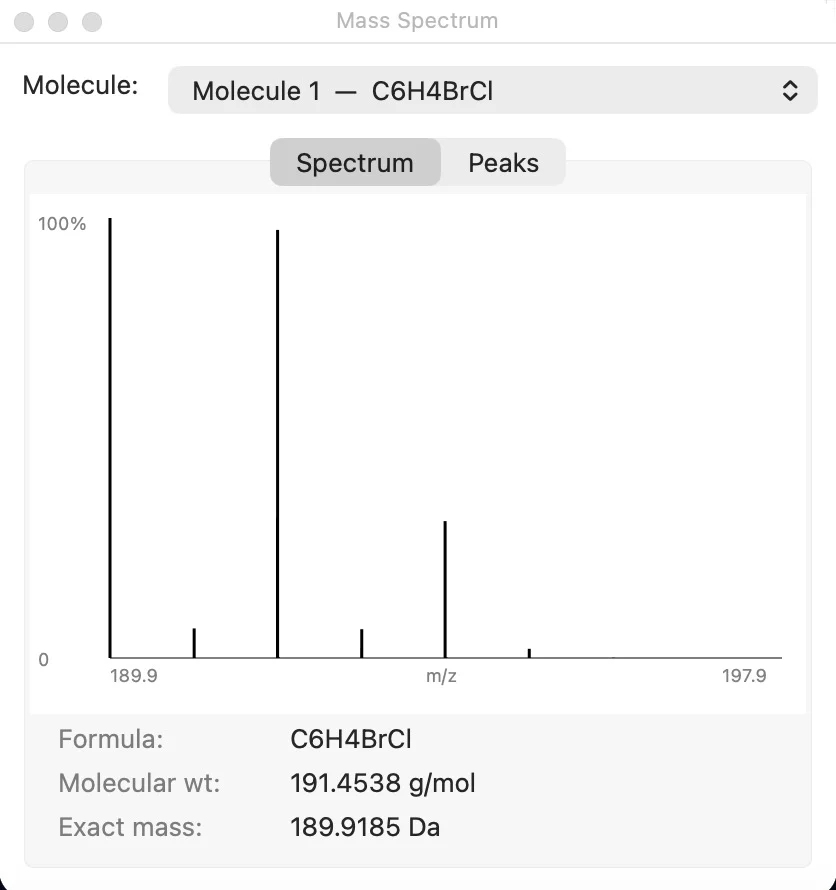
Worked example: one bromine and one chlorine
Bromine is about half 79Br and half 81Br; chlorine about three quarters 35Cl and a quarter 37Cl. Together they give 1-bromo-4-chlorobenzene (C6H4BrCl) a three-line cluster two mass units apart:
m/z 190 M 77
m/z 192 M+2 100
m/z 194 M+4 24
The M+2 peak is the tallest because both 81Br35Cl and 79Br37Cl contribute to it. A compound with only one bromine shows two near-equal peaks (M and M+2, 1 : 1); one chlorine gives about 3 : 1.
The simulation covers the isotope distribution of the
intact molecule, not fragmentation. The small M+1 peaks come from
13C.
Try it yourself. ChemPencil runs on macOS 12 and later and on Windows 10 and 11.